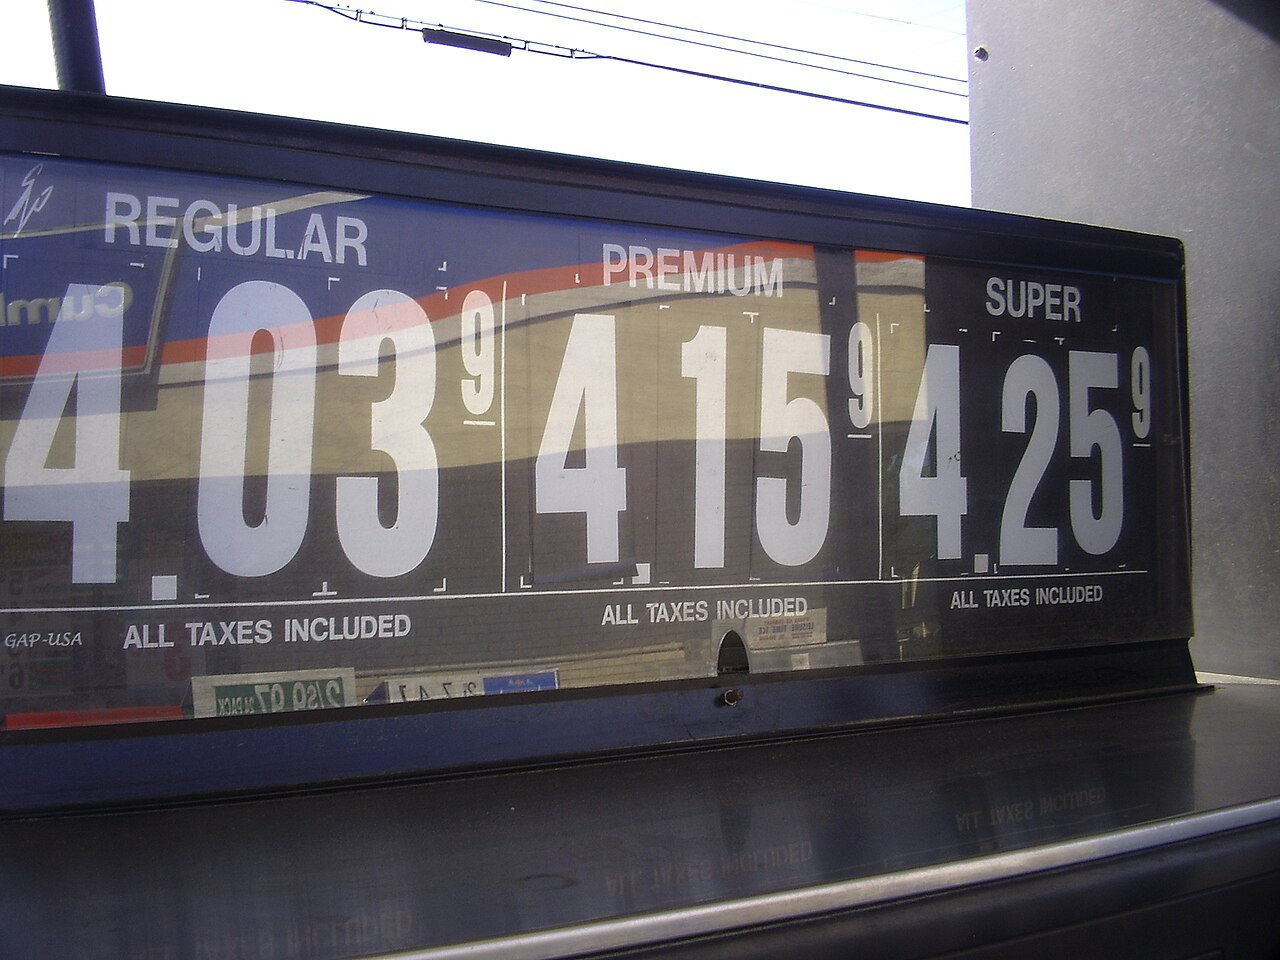
For the first time in months, the overall price of living in America went down. The Consumer Price Index fell 0.4 percent in June on a seasonally adjusted basis, the Bureau of Labor Statistics reported Tuesday morning, the largest one-month decline since April 2020. The driver was no mystery: gasoline prices dropped 9.7 percent in a single month as the spring surge in energy costs finally unwound.
The details in the June CPI release matter for household budgets heading into the back half of the summer. Annual inflation cooled to 3.5 percent, down sharply from 4.2 percent in May, and the quieter story inside the report, groceries still creeping up while nearly everything else stood still, tells you where the pressure actually sits. Here is the read, aisle by aisle.
The pump finally turned
June’s gasoline decline was steep by any standard, 9.7 percent both before and after seasonal adjustment, and it followed a brutal spring: the gasoline index had jumped 21.2 percent in March alone, then kept climbing another 5.4 percent in April and 7.0 percent in May. One good month has not erased that run-up. Pump prices remain 26.7 percent higher than a year ago, and fuel oil, despite falling 9.2 percent in June, is still up 42.9 percent over twelve months.
The broader energy index fell 5.7 percent for the month, its largest decline since April 2020, but sits 15.7 percent above last June. Translation for drivers: real relief is showing up at the pump right now, yet a fill-up still costs meaningfully more than it did on last summer’s road trips.
Groceries: creeping, not surging
Food at home rose 0.2 percent in June, the same modest pace as the month before, and grocery prices are up 2.7 percent over the past year. That is an ordinary inflation rate, not a crisis, but the moves inside the cart were uneven. Eggs jumped 4.3 percent in June alone, dairy products rose 1.2 percent, and the meats, poultry, fish, and eggs group climbed 0.6 percent. Cereals and bakery products added 0.3 percent.
There were offsets. Coffee fell 2.0 percent, pulling the nonalcoholic beverages index down 1.5 percent, and fruits and vegetables slipped 0.2 percent for the month, though produce remains the year’s grocery pain point at 5.3 percent above last June. Restaurant prices kept their steady grind higher: food away from home rose 0.2 percent in June and 3.4 percent over the year, with sit-down restaurants up 3.7 percent.
Utility bills eased a little
Household energy gave summer budgets some help. Electricity prices fell 1.0 percent in June, right as air-conditioning season peaked, though they remain 4.0 percent higher than a year ago. Natural gas ticked up 0.5 percent for the month and is up 3.0 percent over the year. Those year-over-year increases are close to the overall inflation rate, a far cry from the double-digit utility spikes of a few years back.
The rest of the basket went quiet
Strip out food and energy and prices were flat in June, unchanged for the month, with core inflation easing to 2.6 percent over the year. Shelter, the heavyweight of most budgets, rose just 0.1 percent, its smallest monthly increase since January 2021. Car insurance fell 2.0 percent, apparel dropped 0.6 percent, and used vehicles slipped 0.2 percent. The loudest exception is travel: airline fares are running 26.5 percent above last year, a number anyone pricing a late-summer trip has already felt. The full category detail is in the tables at the BLS Consumer Price Index program.
Why the monthly and yearly numbers disagree
It can feel contradictory to read that gas fell nearly 10 percent while the same report says it costs 26.7 percent more than last year. Both are true, and the difference is the time frame. The monthly change compares June with May and captures what is happening right now. The 12-month change compares June with last June, so it still carries the entire spring run-up inside it. When a spike is recent, the annual number stays elevated for months even after prices at the register stop climbing. For week-to-week budgeting, the monthly direction is usually the more useful signal; for judging whether your paycheck has kept up, the annual figure is the honest yardstick.
What to watch from here
One month is one month. The 12-month gasoline comparison will stay ugly until the spring spike ages out of the math, and a single quiet core reading does not guarantee another. But June’s report is the first in a while where the direction of nearly every line item favored the household: cheaper gas, flat core prices, shelter decelerating, and groceries rising at a pace that annual raises can plausibly match.
The next test comes quickly. The July CPI report is scheduled for release on August 12, per the BLS release calendar, and it will show whether June’s pump-price relief held through the heart of driving season. For now, the practical takeaway is straightforward: if a big fill-up-heavy trip is on your calendar, prices are moving your way for the first time since winter, and the grocery list, while not getting cheaper, has at least stopped accelerating.

Leave a Reply